
By Sarah Martin, Director of Economic Research
The bottom line
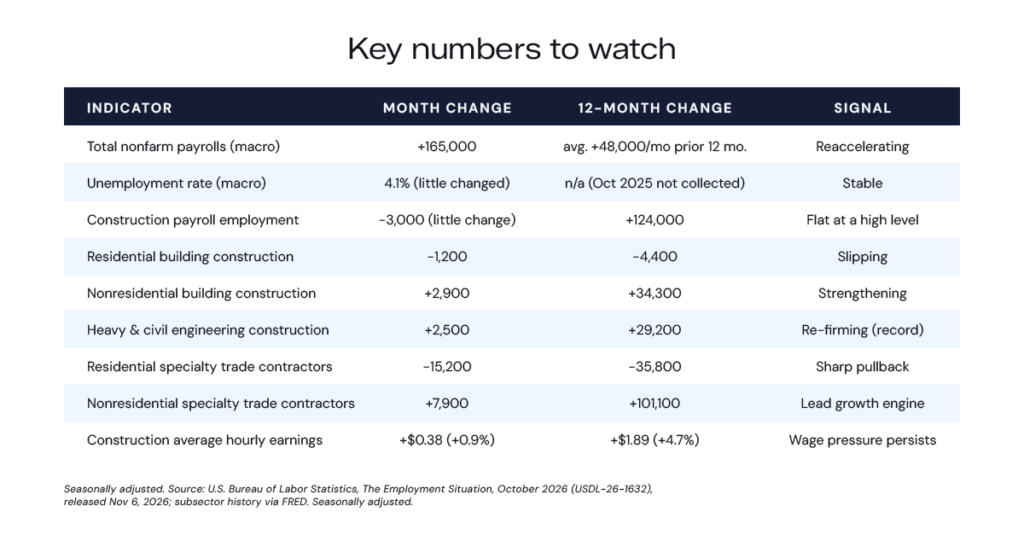
Total nonfarm payrolls rose by 165,000 in October, well above the prior year’s pace, and revisions added a combined 84,000 to August and September. The unemployment rate held at 4.1 percent. Construction employment was essentially flat, staying near its record high. The steady top line hides a familiar split: nonresidential work set fresh records, while residential building edged down and residential specialty trade contractors fell by 15,200, the sharpest move in the release.
What the data shows
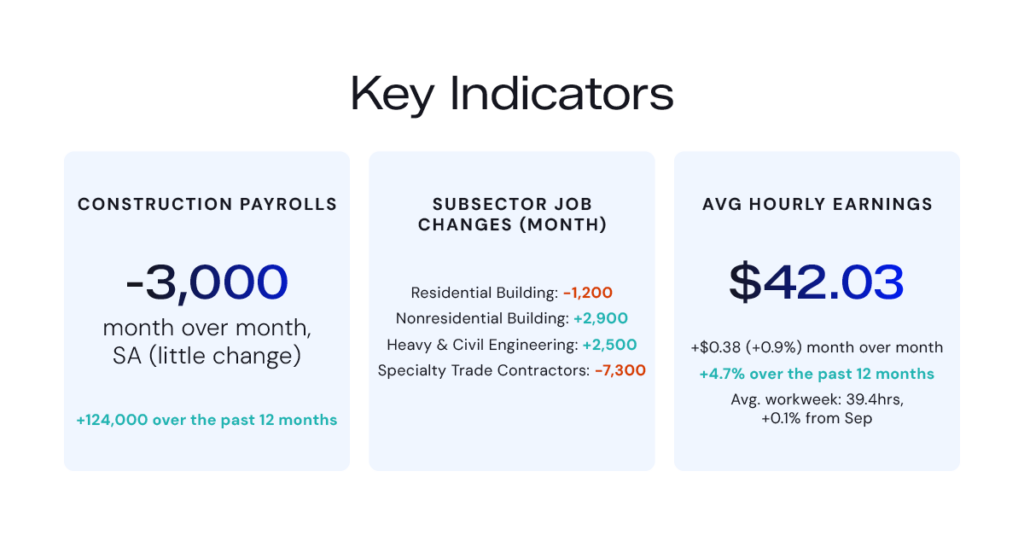
Construction employment stood at 8.36 million in October (seasonally adjusted), down 3,000 jobs from September’s record high and up 124,000 from a year earlier. The small monthly dip is not cause for concern. The contrast is with the wider market, where hiring accelerated sharply and earlier months were revised up by a combined 84,000. For the first time in several months, construction is the laggard rather than the outperformer, even as it sits at the top of its historical range.
Beneath the flat headline, the split within construction is sharp. Nonresidential building, nonresidential specialty trades and heavy and civil engineering all added jobs in October, while residential building and residential specialty trades pulled back. Over the past year, nonresidential specialty trades have been construction’s largest growth engine. Heavy and civil engineering is a steadier third leg that leans on public budgets rather than the housing cycle.
Trend context
The residential weakness is no longer mainly in builder payrolls. Residential building construction, which covers homebuilders’ direct employees, is down only modestly. The deeper decline is in residential specialty trade contractors, the framing, concrete, electrical, plumbing and finishing crews that do most of the on-site labor. That group is down 35,800 jobs over the year, with much of the loss coming in October.
One caution: specialty employment can also fall because crews consolidate or because many projects reach the same stage at once, not only because demand is retreating. Even so, the twelve-month path is the steadier signal, and it shows residential specialty trades trending lower while their nonresidential counterparts climb. Whether October’s drop is a one-month blip or the start of a sharper contraction is the open question for next month.

What it means for construction
For hiring and labor availability, the split is the operative fact. Contractors bidding nonresidential and infrastructure work compete for crews in an industry with very low unemployment, and nonresidential specialty trades account for most of construction’s annual job growth. Residential contractors face the opposite: a year of cuts concentrated in the specialty crews a project needs most. Those workers do not vanish when housing slows. Many are drawn to higher-paying data center and other commercial work, which can make them harder and costlier to recall when housing turns back up.
For owners and developers, the cost signal has not eased. Average hourly earnings are up 4.7 percent over the year, well above the 3.1 percent private sector; the workweek held at 39.4 hours, and average weekly earnings are up 6.1 percent.
Residential construction may continue to face headwinds into next year, given affordability and demographic constraints, which could keep residential employment subdued.
Note on data and interpretation: Household survey data for October 2025 were not collected because of the federal government shutdown, so year-ago unemployment comparisons are unavailable, and the construction industry unemployment rate of 3.6 percent (not seasonally adjusted) has no published year-ago figure.
Source: U.S. Bureau of Labor Statistics, The Employment Situation, October 2026 (USDL-26-1632), released November 6, 2026. Payroll detail from table B-1, hours from table B-2, earnings from table B-3, and industry unemployment rates from table A-14. All figures seasonally adjusted unless otherwise noted. Household survey data for October 2025 were not collected due to the federal government shutdown. The next Employment Situation, covering November 2026, is scheduled for Friday, December 4, 2026.