
Written by: Eric Gaus, Chief Economist at Dodge Construction Network
The Bottom Line
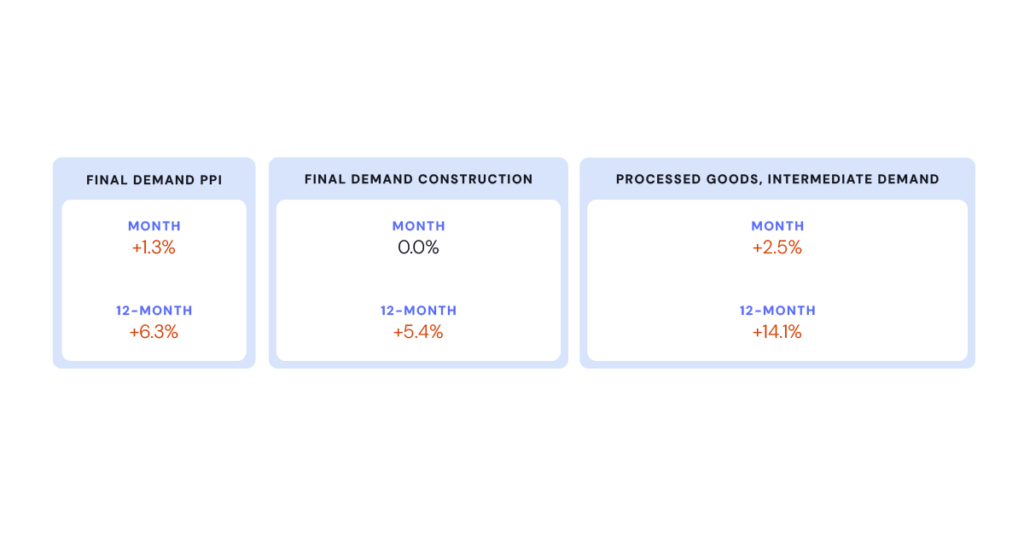
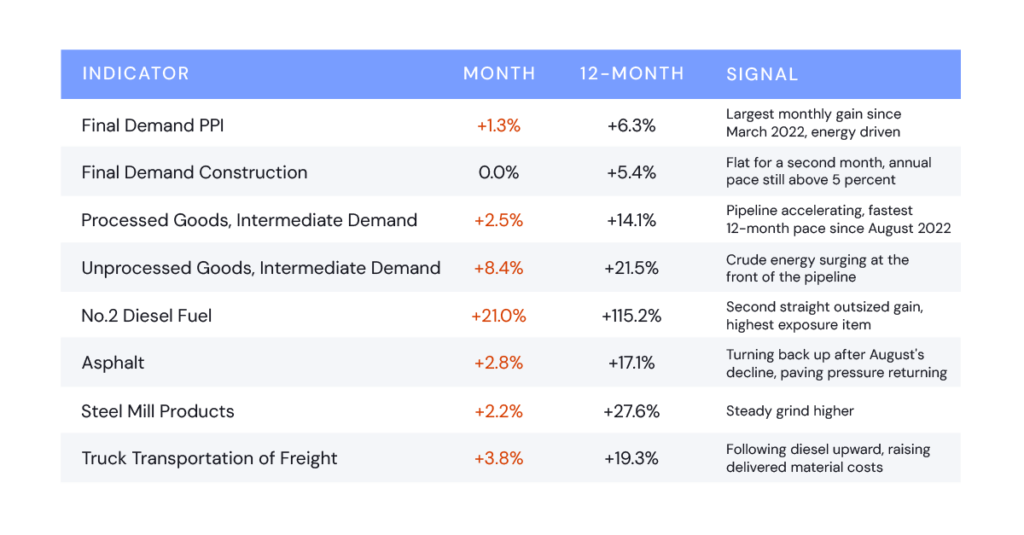
Intermediate construction prices continue to rise according to the latest PPI release. Processed and unprocessed intermediate goods increased 2.5% and 8.4% over the month, respectively. Energy did almost all of the work, with gasoline up 20.3 percent and No. 2 diesel fuel up 21.0 percent. Final demand construction did not move at all for the second month running. The margin between what contractors pay for inputs and what GC’s receive continues to tighten. A repricing is on the horizon.
Key Indicators
What the Data Shows
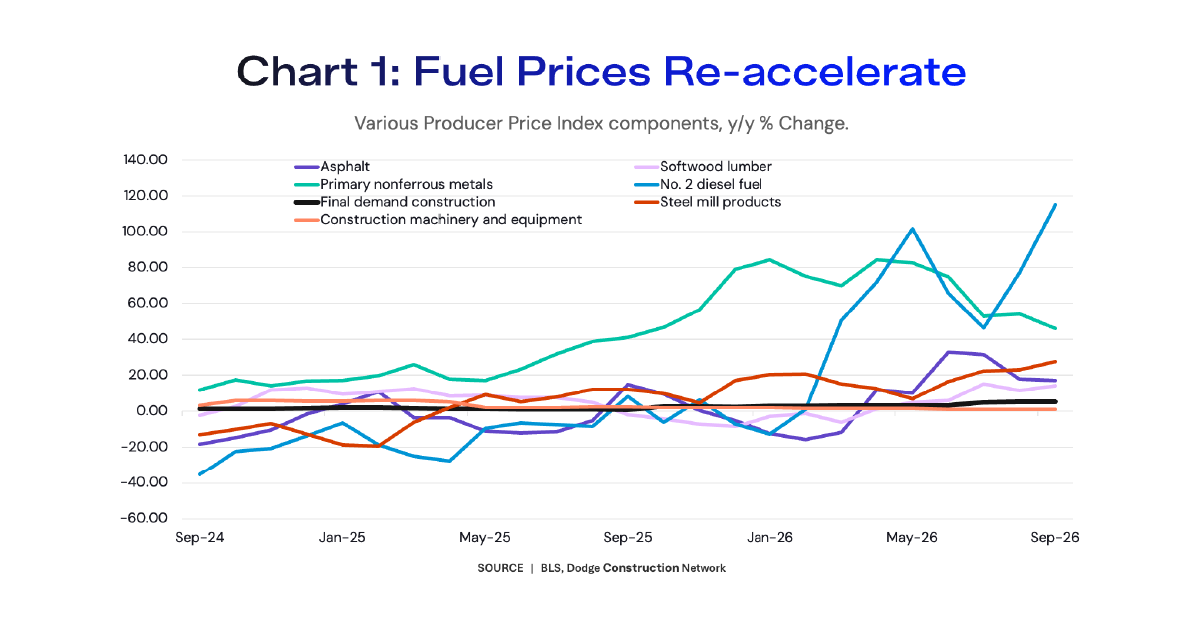
Energy remains the story. No. 2 diesel fuel rose 21.0 percent on top of August’s 23.6 percent increase and now stands 115.2 percent above its September 2025 level. Gasoline jumped 20.3 percent and is up 64.3 percent for the year. BLS traces half of the rise in final demand goods to gasoline alone. Crude petroleum, further upstream, rose 28.3 percent. Asphalt turned back up, rising 2.8 percent and sitting 17.1 percent above a year ago. Truck freight rose 3.8 percent and is up 19.3 percent, consistent with carriers passing fuel into rates.
Metals kept climbing, more slowly, but still significant. Steel mill products rose 2.2 percent, a gain in each of the five months BLS shows, and are up 27.6 percent. Copper and brass mill shapes rose 1.4 percent and are up 30.0 percent. Aluminum mill shapes were flat, down 0.1 percent, and remain up 25.2 percent. Primary nonferrous metals rose 0.6 percent and are up 46.1 percent, and nonferrous metal ores rose 2.3 percent and are up 61.3 percent, though the release does not establish how much of that reaches mill products, or when.
Everything else is up for the year, but relatively speaking more muted. Softwood lumber fell 1.4 percent, a second straight decline, and is up 14.2 percent for the year. Cement is down 1.2 percent over 12 months, while concrete products and aggregates each rose less than one percent. Construction machinery and equipment was unchanged for a second consecutive month and is up just 1.7 percent, the mildest series in this report. Materials and components for construction, the broadest input measure, rose 0.5 percent and is up 5.7 percent.
Trend Context
The intermediate demand pipeline, which captures what producers pay before goods reach final demand, accelerated. Processed goods for intermediate demand rose 2.5 percent, with more than 80 percent of that from a 10.2 percent rise in processed energy goods. Unprocessed goods rose 8.4 percent, the largest monthly gain since February 2022. The 12-month readings matter more: processed goods are up 14.1 percent and unprocessed goods 21.5 percent, against 5.4 percent for final demand construction. The pipeline has run well ahead of construction prices. If the usual pass-through holds, that points to more cost pressure ahead, though this release establishes neither its size nor its timing.
September reads as an amplified August rather than a new pattern. BLS revised May through August in this release: August final demand is now 0.5 percent rather than 0.4 percent, August diesel 23.6 percent rather than 24.1 percent, and August asphalt a 7.1 percent decline rather than 8.2 percent. The story did not change, but its duration did. Two consecutive months of double-digit energy increases are harder to dismiss than one, though energy reversed quickly twice this year, in June and July.
What It Means for Construction
For estimators pricing work this fall, fuel is now the key driver. Diesel has more than doubled year over year and truck freight has begun to follow, which lifts the delivered cost of everything arriving by truck, not only the fuel burned on site. On earthwork, paving, and haul-heavy scopes, pricing fuel from a current index reading rather than a quarterly average is worth considering. Escalation language deserves a harder look than it did in spring. Fixed-price work already signed with heavy equipment hours carries exposure.
While the main effect is the supply shock, the strength of demand across building types will create nuance in the price effect. New office building construction is up 6.0 percent over the past year and new industrial 5.7 percent, while new warehouse construction is up 4.5 percent and new school and new health care construction are each up 5.2 percent. Setting contingency by building type will track real exposure better than one blended number.
The divergence between input costs and construction prices is the thing to watch. Construction selling prices have been flat for two months while the goods going into construction rose at double-digit annual rates. That gap resolves through contractor margins, through productivity, or through construction prices catching up, and this release cannot say which, because PPI measures prices and not margins. The signals to watch in the October data are whether energy holds these gains and whether final demand construction begins to move higher.
Key Numbers to Watch
Data source: U.S. Bureau of Labor Statistics, Producer Price Index, September 2026 (USDL 26-1576), released October 15, 2026.
Monthly percent changes reflect seasonally adjusted data where BLS publishes a seasonal factor. Final demand construction and most individual commodity series, including diesel fuel, asphalt, steel mill products, nonferrous metals, softwood lumber, and construction machinery and equipment, are not seasonally adjusted, consistent with BLS practice for these series. All figures are preliminary and subject to revision for up to four months after original publication. This report is prepared for internal planning purposes and does not constitute financial or investment advice.
Related Articles:
Producer Prices Surge in April. Construction Feels The Heat.
Dodge Momentum Index Grows 6% in May
January Update on Census Housing Starts and Construction Put-in-Place Spending