Written by: Eric Gaus, Chief Economist at Dodge Construction Network
The Bottom Line
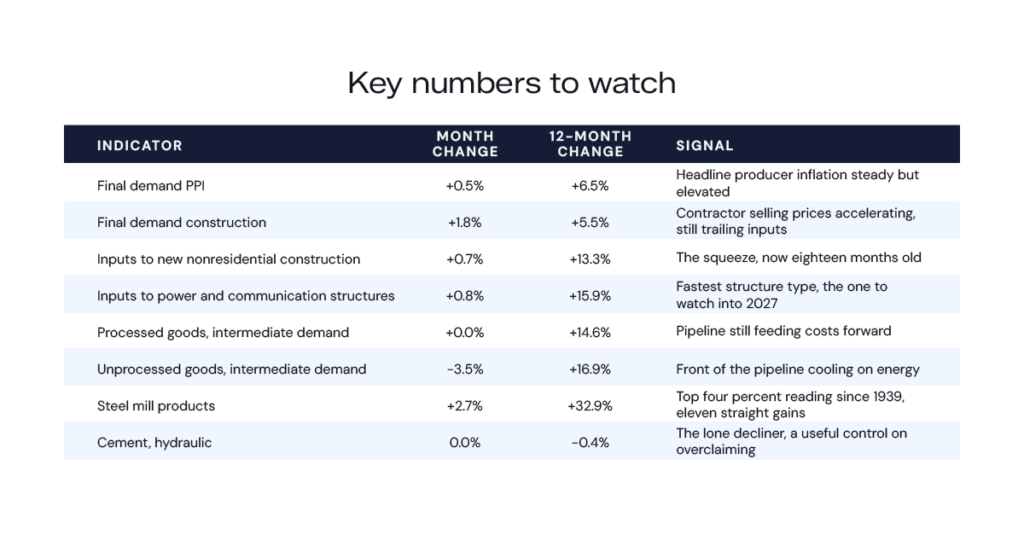
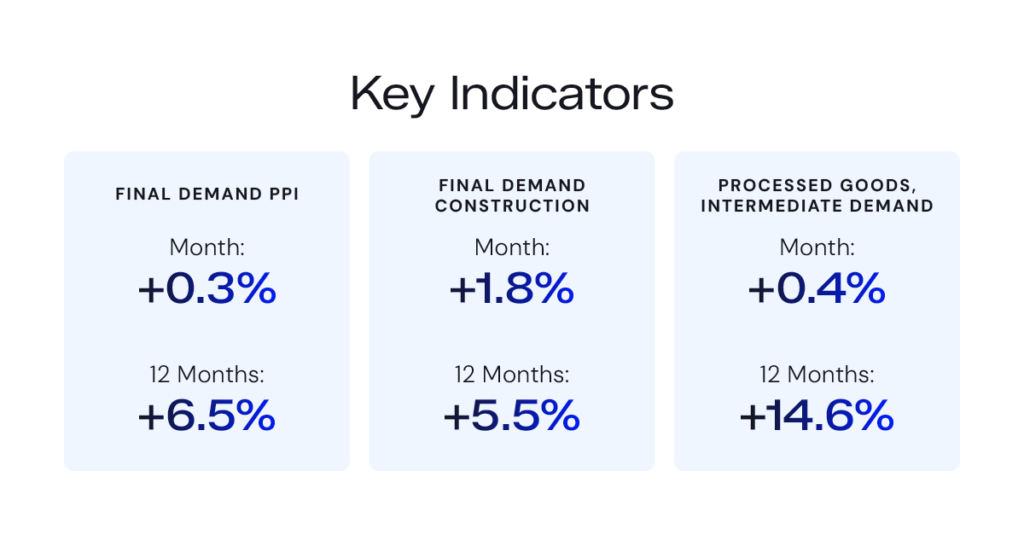
Construction input costs kept climbing in October while the structures carrying the industry’s growth, power and communications, recorded the fastest input inflation of any building type. Producer prices for final demand rose 0.3 percent in October and 6.5 percent over the year, a moderate headline that conceals a sharp divergence. Construction’s own input basket rose 13.3 percent over the twelve months, and 51 of the 66 construction series we track stood at an all-time high that month, the broadest reading since April 2022.
The headline hides where that pressure concentrates. Inputs to power and communication structures rose 15.9 percent over the year, the fastest of the nine structure types PPI publishes, and now run 3.5 points ahead of the all-construction average, the fourth widest gap in the 131 months of that comparison. Power generation continues to support the forecast, but these rapidly accelerating costs threaten to temper that growth.
Key Indicators
What the Data Shows
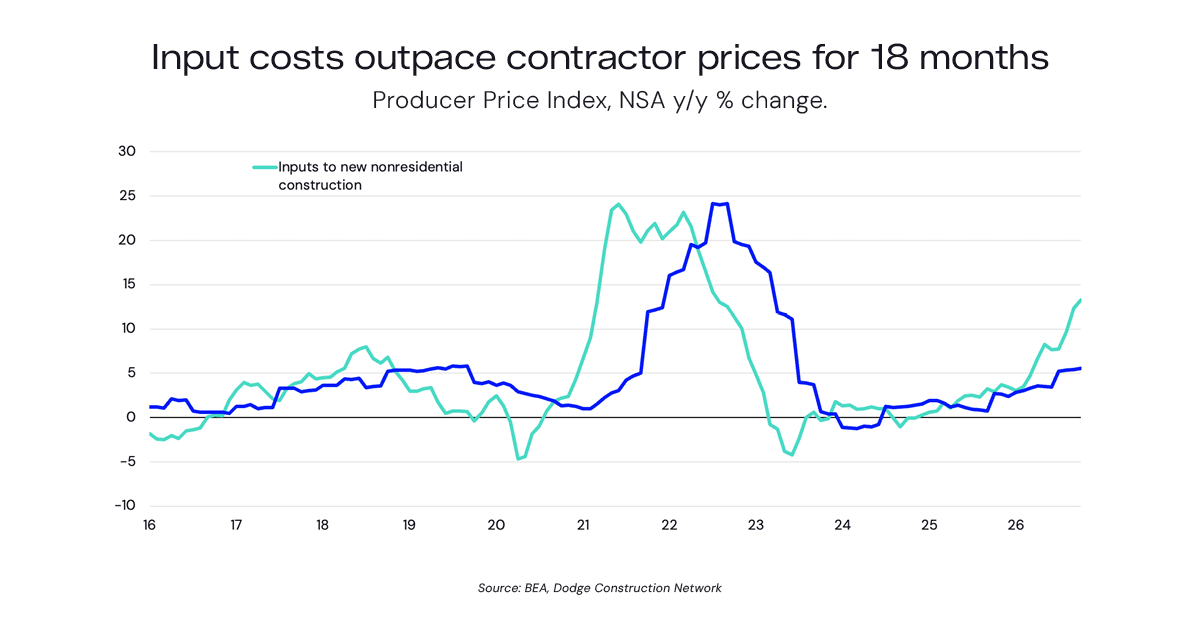
The clearest construction signal in this release is a gap the release itself does not report. The number that matters sits between what contractors buy and what contractors charge. Inputs to new nonresidential construction rose 13.3 percent over the twelve months to October. New nonresidential building construction, the contractor output index, rose 5.5 percent. The 7.7 point gap is the twelfth widest in favor of inputs since the comparison begins in December 2015, and October was the eighteenth consecutive month in which inputs rose faster. The longest run in the data is nineteen months.
Metals did most of the work, as a consequence of the steep steel and aluminum tariffs. Steel mill products rose 32.9 percent over the year, a reading in the top four percent of a series that begins in 1939. Copper and brass mill shapes rose 23.9 percent and aluminum mill shapes 23.3 percent. Metals and metal products as a group reached an all-time high in a series running back to 1926. Against that, cement was the only one of the 66 series we track cheaper than a year ago, down 0.4 percent and now in its tenth straight month of annual decline.
Sorted by structure type, the pressure is uneven. Power and communication structures lead at 15.9 percent, highways and streets follow at 13.5 percent and industrial structures at 13.3 percent, while residential inputs trail at 10.4 percent. Power and communication inputs have now run ahead of the all-construction average for ten consecutive months.
Trend Context
The intermediate demand pipeline still points upward. Processed goods for intermediate demand rose 0.4 percent in October on a seasonally adjusted basis, a third consecutive monthly increase, and 14.6 percent over the year. That is the stage that feeds contractor costs with a lag. At a double-digit annual rate it argues the gap described above has further to run rather than less.
The front of the pipeline tells a different story. Unprocessed goods for intermediate demand fell 3.1 percent on the month even while standing 16.9 percent above a year ago, and BLS attributes the decline to energy, with crude petroleum down 10.3 percent and diesel fuel down 7.9 percent. Construction energy inputs fell 3.2 percent in October despite sitting 74.4 percent above a weak October 2025 base. The energy shock that organized the first half of 2026 is losing force at the raw end. Whether that relief reaches contractors depends on how much of it is already locked into processed goods.
What It Means for Construction
For bidding and contracting, the exposure sits in backlog rather than in new work. A fixed-price job bid in early 2025 was priced when input and output inflation were level, and it is being delivered with inputs 7.7 points ahead. An escalation clause written against a general construction index will not capture that, because the general index is the output side of exactly this gap. A clause indexed to inputs to new nonresidential construction, or to a named materials basket, would have.
For owners and developers, the structure-type detail should change where contingency sits. A data center, substation or transmission project carries input inflation running 5.6 points faster than a residential project and 4.3 points faster than a commercial one. Where a capital plan applies one escalation rate across a mixed portfolio, the power and communications line is under-reserved.
On the divergence itself, one caution; PPI measures transaction prices, not margins. An input index up 13.3 percent set against an output index up 5.5 percent is consistent with compressed contractor margins, but equally with a changing mix of work, productivity gains, or output prices catching up later. What the data does support is narrower: the gap widened from 0.2 points in January to 7.7 in October, not without interruption, and the run is one month short of the longest on record.
Key Numbers to Watch