
Every time your sales team pitches a building product, the outcome offers a critical lesson. When you win a project, you want to replicate that success. When you lose, you need to understand exactly what went wrong. Unfortunately, most building product manufacturers rely on anecdotes rather than hard facts to explain these outcomes.
Sales representatives often blame pricing when they lose a bid. When they win, they credit their excellent relationship-building skills. Relying on these subjective feelings creates massive blind spots in your business strategy. To truly improve your competitive positioning, you need an objective approach grounded in reality.
This post will show you how to conduct a formal win/loss analysis using robust project data. We will explore the exact steps you need to take to uncover the real reasons behind your market performance. Finally, we will highlight how Dodge Construction Network provides the specific tools and data you need to optimize your sales efforts and win back lost opportunities.
What is Win/Loss Analysis?
Win/loss analysis is the systematic review of past sales opportunities to determine why a deal closed or failed. In the construction industry, this goes far beyond reviewing a single phone call or email thread. It requires tracing the entire lifecycle of a project specification.
You must look at the early design phase, the bidding process, and the final contractor selection. A proper analysis evaluates the behavior of architects, engineers, general contractors, and competitors. By reviewing these elements objectively, you move away from guesswork. You start building strategies based on undeniable patterns.
Running this analysis consistently completely transforms your sales culture. It shifts the focus from making excuses to finding actionable solutions. When your team understands the mechanics behind a lost specification, they can adjust their approach for the next pitch.
The Core Components of Project Data
To run an effective analysis, you need the right raw materials. You cannot evaluate your performance without comprehensive project data. This data breaks down into a few critical components that tell the full story of a construction build.
Firm-Level Behavior and History
Every project involves a network of decision-makers. You need data that shows the historical behavior of the specific architectural and engineering firms involved. Do they have a long history of specifying your competitor? Have they ever used your product before?
Understanding firm-level behavior provides essential context for your analysis. If you lost a bid with a firm that exclusively uses a rival brand, the loss might stem from a deeply entrenched relationship rather than a flaw in your product. Recognizing this helps you adjust your expectations and tailor your future outreach to that specific firm.
Geographic and Sector Trends
Projects do not happen in a vacuum. Local building codes, regional economic trends, and sector-specific demands all influence the final specification. Your win/loss analysis must factor in these broader environmental elements.
For example, your data might reveal that you consistently lose hospital projects in the Pacific Northwest. This specific intersection of geography and sector indicates a targeted problem. It tells you exactly where to focus your investigation. You can then determine if your product lacks a specific certification required for healthcare facilities in that region.
A Step-by-Step Guide to Running Your Analysis
Conducting a win/loss analysis requires a structured, repeatable process. You cannot look at the data randomly and expect to find meaningful insights. Follow these steps to turn raw project data into a refined business strategy.
Step 1: Gather Comprehensive Intelligence
The first step involves collecting every piece of data related to the project in question. You need the original plans, the addenda, and the final list of specified materials. You also need to know the timeline of the project.
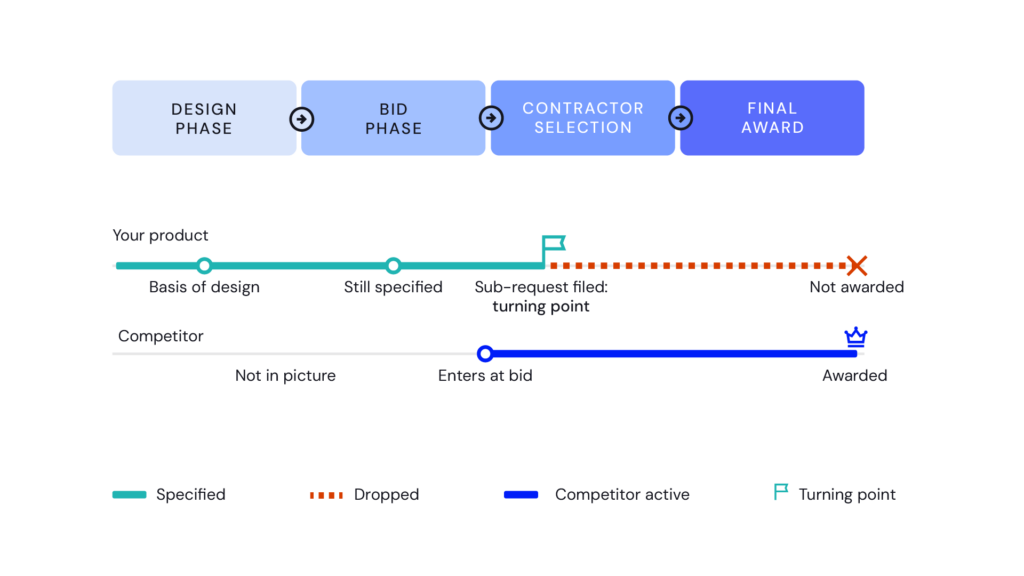
Did the architect specify your product in the initial design phase? Was your product listed as the basis of design, or were you an “or equal” alternative? Gathering this baseline intelligence establishes the starting point for your investigation. If you do not have a clear picture of the initial specification, you cannot accurately determine where things went wrong.
Step 2: Identify the Turning Points
Once you have the timeline mapped out, look for the exact moment the project shifted. If you started as the basis of design but lost the final bid, a specific event triggered that change. This is the turning point.
Did a general contractor submit a request for substitution? Did an addendum explicitly remove your product from the plans? Pinpointing the turning point allows you to ask the right questions. Instead of wondering why you lost the overall project, you can investigate why a specific contractor requested a substitution on a specific Tuesday in October.
Step 3: Map Out Competitor Movement
You must understand who beat you and how they did it. Look closely at the competitor who ultimately won the specification. Analyze their movement throughout the project lifecycle.
Did they aggressively target the general contractor during the bidding phase? Did they offer a bundled package that included complementary materials? By mapping out their strategy, you can identify your own vulnerabilities. You learn exactly what tactics your rivals use to break your specifications, allowing you to build defensive countermeasures.
Real-World Examples of Optimizing Sales
When you consistently apply win/loss analysis, you uncover highly actionable insights. You can use these insights to optimize your daily sales operations. Here are a few ways businesses use this data to drive revenue.
Recovering a Lost Opportunity
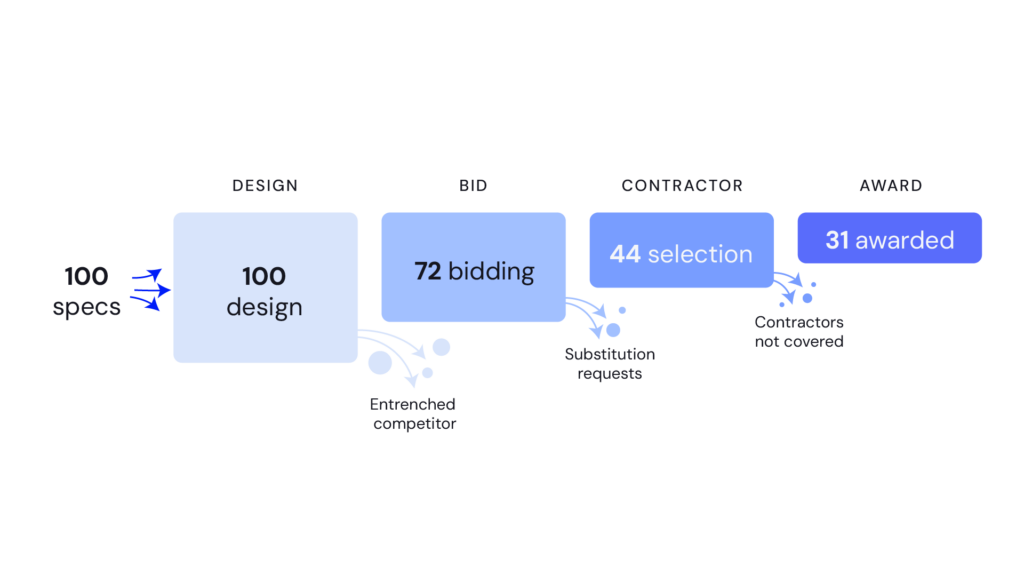
Imagine your company manufactures commercial lighting fixtures. You review the data for a major office build you recently lost. Your analysis reveals that the architect originally specified your product, but the electrical contractor successfully substituted a cheaper alternative during the bidding phase.
This analysis highlights a critical gap in your sales strategy. Your team successfully sold the architect but completely ignored the contractor. To recover future opportunities, you change your process. You mandate that your sales representatives proactively contact the awarded electrical contractors the moment a project goes out to bid. By defending the specification at the contractor level, you stop the substitutions before they happen.
Defending a Market Stronghold
Win/loss data also helps you protect your most profitable markets. Suppose you notice a slight uptick in lost bids for your acoustic ceiling tiles in the education sector. Your analysis shows that a new, aggressive competitor is consistently underbidding you on school projects in the Midwest.
Because you caught this pattern early, you can launch a targeted defense. You temporarily adjust your pricing structure for Midwest education projects. You also deploy your most experienced sales representatives to visit the top school board architects in the region. You use the data to build a firewall around your market stronghold before the competitor can gain serious traction.
How Dodge One Elevates Your Analysis
Gathering and analyzing this level of detail manually takes hundreds of hours. Reading through thousands of pages of project documents to find a single substitution request is simply not scalable. Dodge One provides the technology necessary to automate and elevate your win/loss analysis.
Unprecedented Access to Project Data
Dodge One tracks hundreds of thousands of active construction projects. We provide unparalleled visibility into the specifications, plans, and addenda. Our platform allows you to see exactly when and where your products enter or exit a project plan.
We track the crucial turning points for you. You do not have to guess when a substitution happened. Our system alerts you to these changes, giving you the exact timeline of events needed for a thorough analysis. This comprehensive data forms the bedrock of any successful strategic shift.
Advanced Filtering and Pattern Recognition
Our tools turn overwhelming amounts of data into clear, easily digestible insights. Dodge One offers advanced filtering capabilities that allow you to segment your wins and losses perfectly. You can filter by region, project value, facility type, or specific architectural firm.
This level of filtering instantly reveals the hidden patterns in your market performance. Our dashboards visually display your win rates against specific competitors. You can immediately see if a rival is gaining ground in a specific sector. We empower your leadership team to move past anecdotes and make rapid, data-driven decisions.
Refine Your Strategy and Win More Business
Operating without formal win/loss analysis leaves your business vulnerable to repeated mistakes. You cannot fix a leak in your sales pipeline if you refuse to look at the pipe. Embracing data-driven analysis is the only way to secure a lasting competitive advantage in the construction industry.
By understanding the exact reasons behind your successes and failures, you empower your sales team to work smarter. You stop wasting time on the wrong targets and start building highly effective, proactive strategies. You learn how to defend your specifications and aggressively pursue white space opportunities.
Stop letting lost bids remain a mystery. Leverage the power of Dodge Construction Network to uncover the truth behind your market performance. Explore our comprehensive project data tools today and start turning your past losses into future victories.
Related Articles:
Are You Growing Ahead of the Market — or Falling Behind?
Your Growth Strategy Has a Blind Spot. Here’s How to Find It.